
So what's an archivist and/or researcher to do?
According to some, assigning and then browsing by subject headings is the solution to this challenge. [2] Before we all jump on that bandwagon, though (how do you even get to meaningful subject headings in the first place when you have regular born-digital accessions that are many GBs to TBs in size, containing tens of thousands, if not hundreds of thousands, of individual documents), let's walk through a couple of exercises on methods and tools that can be used for characterizing and identifying records in the digital age:
- Analysis of Drives
- Digital Forensics
- Digital Humanities Methods and Tools
- Text Analysis with Python
- Named Entity Recognition
- Topic Modeling
Analysis of Drives
This is a good place to start when you don't know anything at all about what it is you've got. The size of the squares indicates the size of the files and folders in a given drive, while the colors indicate the file type.
Tool
 |
| WinDirStat |
Exercise
Examining and considering the files in ES-Test-Files or on your computer.- Download and install WinDirStat. Note: If you are looking for an alternative for Linux, you are looking for KDirStat and for Mac it would be Disk Inventory X or GrandPerspective.
- Open windirstat.exe.
- Examine and consider the files in ES-Test-Files (these were assembled for a guest lecture on this topic) or on your computer.
- When prompted to Select Drives, select All Local Drives, Individual Drives, or A Folder.
- Take a look at the Directory List.
- Take a look at the Extension List.
- Take a look at the Treemap.
- Try coupling the views:
- Directory List → Treemap.
- Treemap → Directory List.
- Directory List | Treemap → Extension List.
- Extension List → Treemap.
- Play around some!
Digital Forensics
Digital forensics encompass the recovery and investigation of material found in digital devices.
Tools
 |
| Bulk Extractor Viewer |
Bulk Extractor is a program that extracts features such as email addresses, credit card
numbers, URLs, and other types of information from digital evidence media.
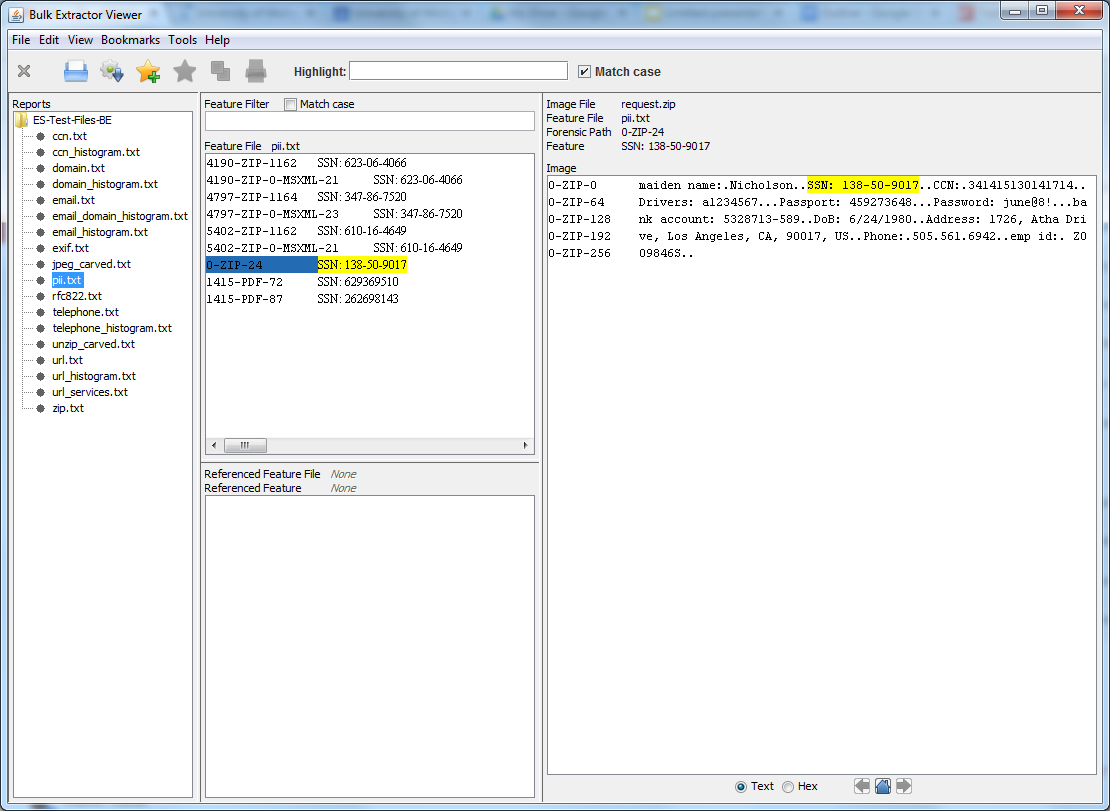
Bulk Extractor Viewer is a user Interface for browsing features that have been extracted via the bulk_extractor feature extraction tool.
Exercise
Examine the contents of Identity_Finder_Test_Data and identify sensitive data, like social security numbers and credit card numbers. You can also use it to find out what e-mail addresses (correspondence series, anyone?), telephone numbers and website people visit (or at least show up in text somewhere), and how often.- Download and install Bulk Extractor. Note: Windows users should use the development build located here.
- Open BEViewerLauncher.exe.
- Under the Tools menu, select Run bulk_extractor…, or hit Ctrl + R.
- When prompted to Run bulk_extractor, scan a Directory of Files and navigate to Identity_Finder_Test_Data.
- Create an Output Feature Directory such as Identify_Finder_Test_Data_BE_Output.
- Take a look at the General Options.
- Take a look at the Scanners. Note: More information on bulk_extractor scanners is located here.
- Submit Run.
- When it’s finished, open the Output Feature Directory and verify that files have been created. Some will be empty and others will be populated with data.
- In Bulk Extractor Viewer select the appropriate report from Reports.
- Take a look at the Feature Filter.
- Take a look at the Image.
- Play around some!
And there's more! This tool is used in BitCurator and we're incorporating this tool and related functionality into the Appraisal and Arrangement tab:
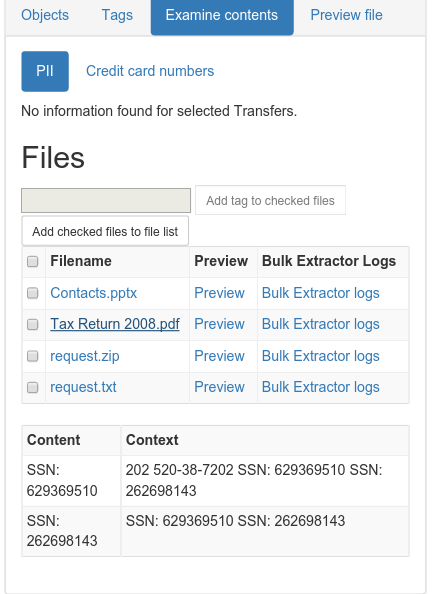 |
| SSNs identified! |
Digital Humanities Methods and Tools
These, arguably, are emerging tools for characterizing and identifying records. Still, whether they are used in conjunction with researchers to answer new and exciting research questions or to create new interfaces to collections, or to decrease the amount of time between accession and access (with the obligatory note that they don't replace trained, human effort to do the work of description) for gigantic collections of born-digital material that you know next to nothing about, these methods and tools are worth a look.
Text Analysis with Python
Method
Text Analysis is automated and computer-assisted method of extracting, organizing, and consuming knowledge from unstructured text.Tools
Python is a widely used general-purpose, high-level programming language.
The Natural Language Toolkit (NLTK) is a leading platform for building Python programs to work with human language data.
Exercise
Note: Much of this is taken from the first chapter of Natural Language Processing with Python: Analyzing Text with the Natural Language Toolkit.
- Download and install Python. Note: Mac users, Python will be pre-installed on your machines. You may also choose to install Python's NumPy and Matplotlib packages (and all their dependencies). This isn't strictly necessary, but you’ll need them in order to produce the graphical plots we'll be using.
- Download and install NLTK.
- Open Interactive DeveLopment Environment (IDLE), or any command line or terminal.
- Type: import nltk
- Type: nltk.download()
- At the NLTK Downloader prompt, select all (or book, if you are concerned about size) and Download.
- Exit the NLTK Downloader.
- Type: from nltk.book import *
- Type: text1, text2, etc. to find out about these texts.
- Type: text1.collocations()to return frequent word combinations.
- Type: text1.concordance(“monstrous”)
- Play around some! For example, look for nation, terror, and god in text4 (Inaugural Address Corpus) and im, ur, and lol in text5 (NPS Chat Corpus).
- Type: text1.similar(“monstrous”)
- Type: text2.similar(“monstrous”)
- Observe that we get different results for different texts. Austen uses this word quite differently from Melville; for her, monstrous has positive connotations, and sometimes functions as an intensifier like the word very.
- Type: text2.common_contexts([“monstrous”, “very”])
- Play around some! Pick another pair of words and compare their usage in two different texts, using the similar() and common_contexts() functions.
- Type: text4.dispersion_plot([“citizens”, “democracy”, “freedom”, “duties”, “America”])
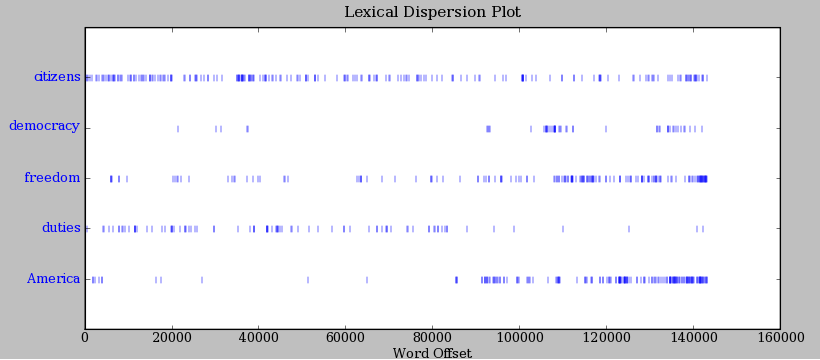 |
| Lexical Dispersion Plot for Words in U.S. Presidential Inaugural Addresses: This can be used to investigate changes in language use over time. |
- Type: len(text3) to get the total number of words in the text.
- Type: set(text3) to get all unique words in a text.
- Type: len(set(text3)) to get the total number of unique words in the text, including differences in capitalization.
- Type: text3_lower = [word.lower() for word in text3] to make all words lowercase. Note: This is so that capitalized and lowercase versions of the same word don't get counted as two words.
- Type: from nltk.corpus import stopwords
- Type: stopwords = stopwords.words(“english”)
- Type: text3_clean = [word for word in text3_lower if word not in stopwords] to remove common words from text.
- Type: len(text3_clean) / len(set(text3_clean)) to get total words divided by set of unique words, or lexical diversity.
 |
| This plot shows lexical diversity over time for the Michigan Technic, a collection we've digitized here at the Bentley, using Seaborn, a Python visualization library based on matplotlib. Not much of a trend either way, although I'm not sure what happened in 1980. |
 |
| Not exactly an archival example, but one of my favorites nonetheless. The Largest Vocabulary in Hip Hop: Rappers, Ranked by the Number of Unique Words in their Lyrics. The Wu Tang Association is not to be trifled with. |
Frequency distributions:
And there's more! Here's an example of a frequency distribution in action:
- Type: fdist1 = nltk.FreqDist(text1)
- Type: print fdist1
- Type: fdist1.most_common(50)
- Type: fdist1.[“whale”]
- Type: fdist1.plot(50, cumulative=True)
- Play around some! Try the preceding frequency distribution example for yourself.
- Type: fdist1.hapaxes() to view the words in the text that occur only once.
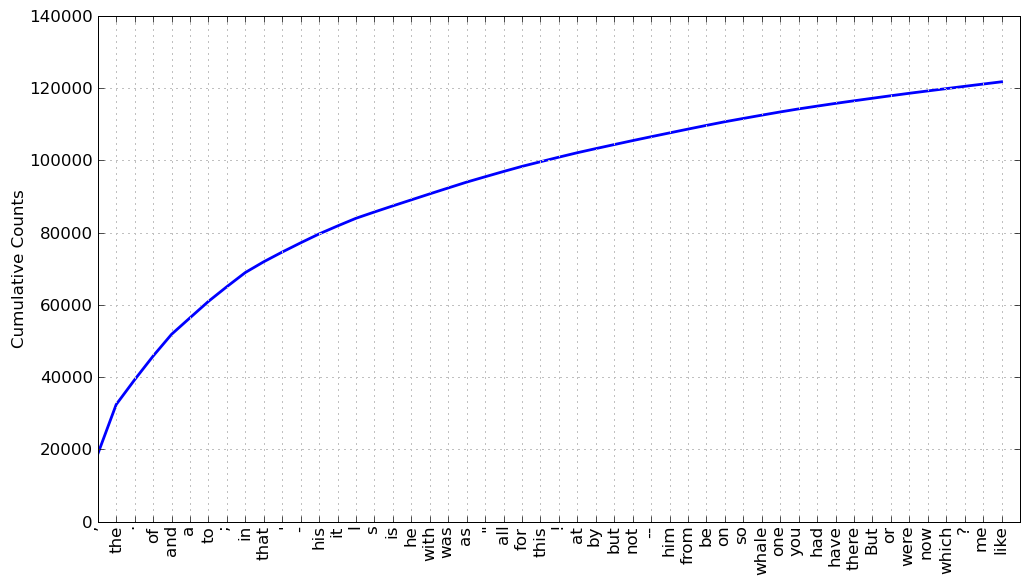 |
| Cumulative Frequency Plot for 50 Most Frequently Words in Moby Dick: these account for nearly half of the tokens. |
 |
| A word cloud (an alternative way to visualize frequency distributions), again for the Michigan Technic. If you couldn't tell from "engineer" and "engineers" and "engineering" (not to mention "men" and "man" and "mr."), this is an engineering publication. |
Named Entity Recognition [3]
Method
Named Entity Recognition (NER) seeks to locate and classify elements in text into predefined categories such as the names of persons, organizations, locations, expressions of times, quantities, monetary values, percentages, etc.
Tool
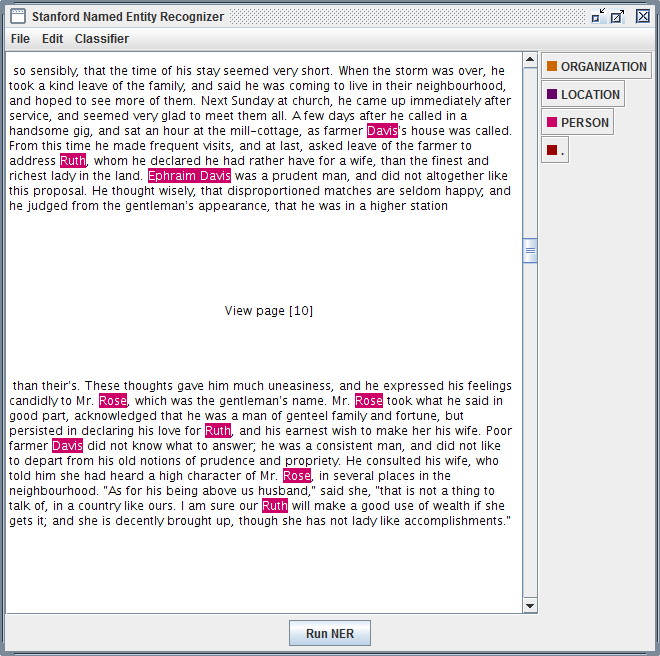 |
| Stanford Named Entity Recognizer |
Stanford Named Entity Recognizer (Stanford NER) is a Java implementation of Named Entity Recognizer. Named Entity Recognition (NER) is method that allows automatic labeling of things like people, organizations, and geographic locations in unstructured text.
Exercise
- Download and unzip Stanford NER.
- Download and unzip looted_heritage_reports_txt.zip.
- Open stanford-ner.jar.
- Under Classifier click Load CRF From File.
- Navigate to Stanford-ner-2015-04-20/classifiers/english.all.3class.distsim.crf.ser.gz.
- Under the File menu, click Open File.
- Navigate to any file in the unzipped looted_heritage_reports_txt folder (or use any text file).
- Click Run NER.
- Observe that every entity that Stanford NER is able identify is now tagged.
- Under the File menu, click Save Tagged File As …
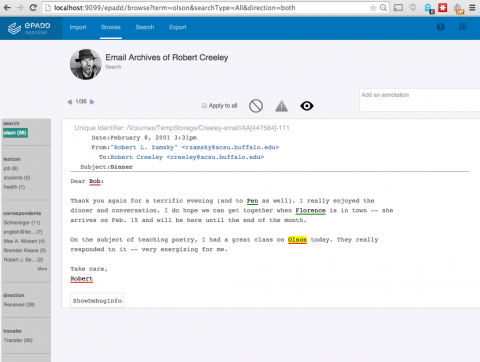 |
| ePADD, a software package developed by Stanford University's Special Collections & University Archives, supports archival processes around the appraisal, ingest, processing, discovery, and delivery of email archives. This image previews it's natural language processing functionality. |
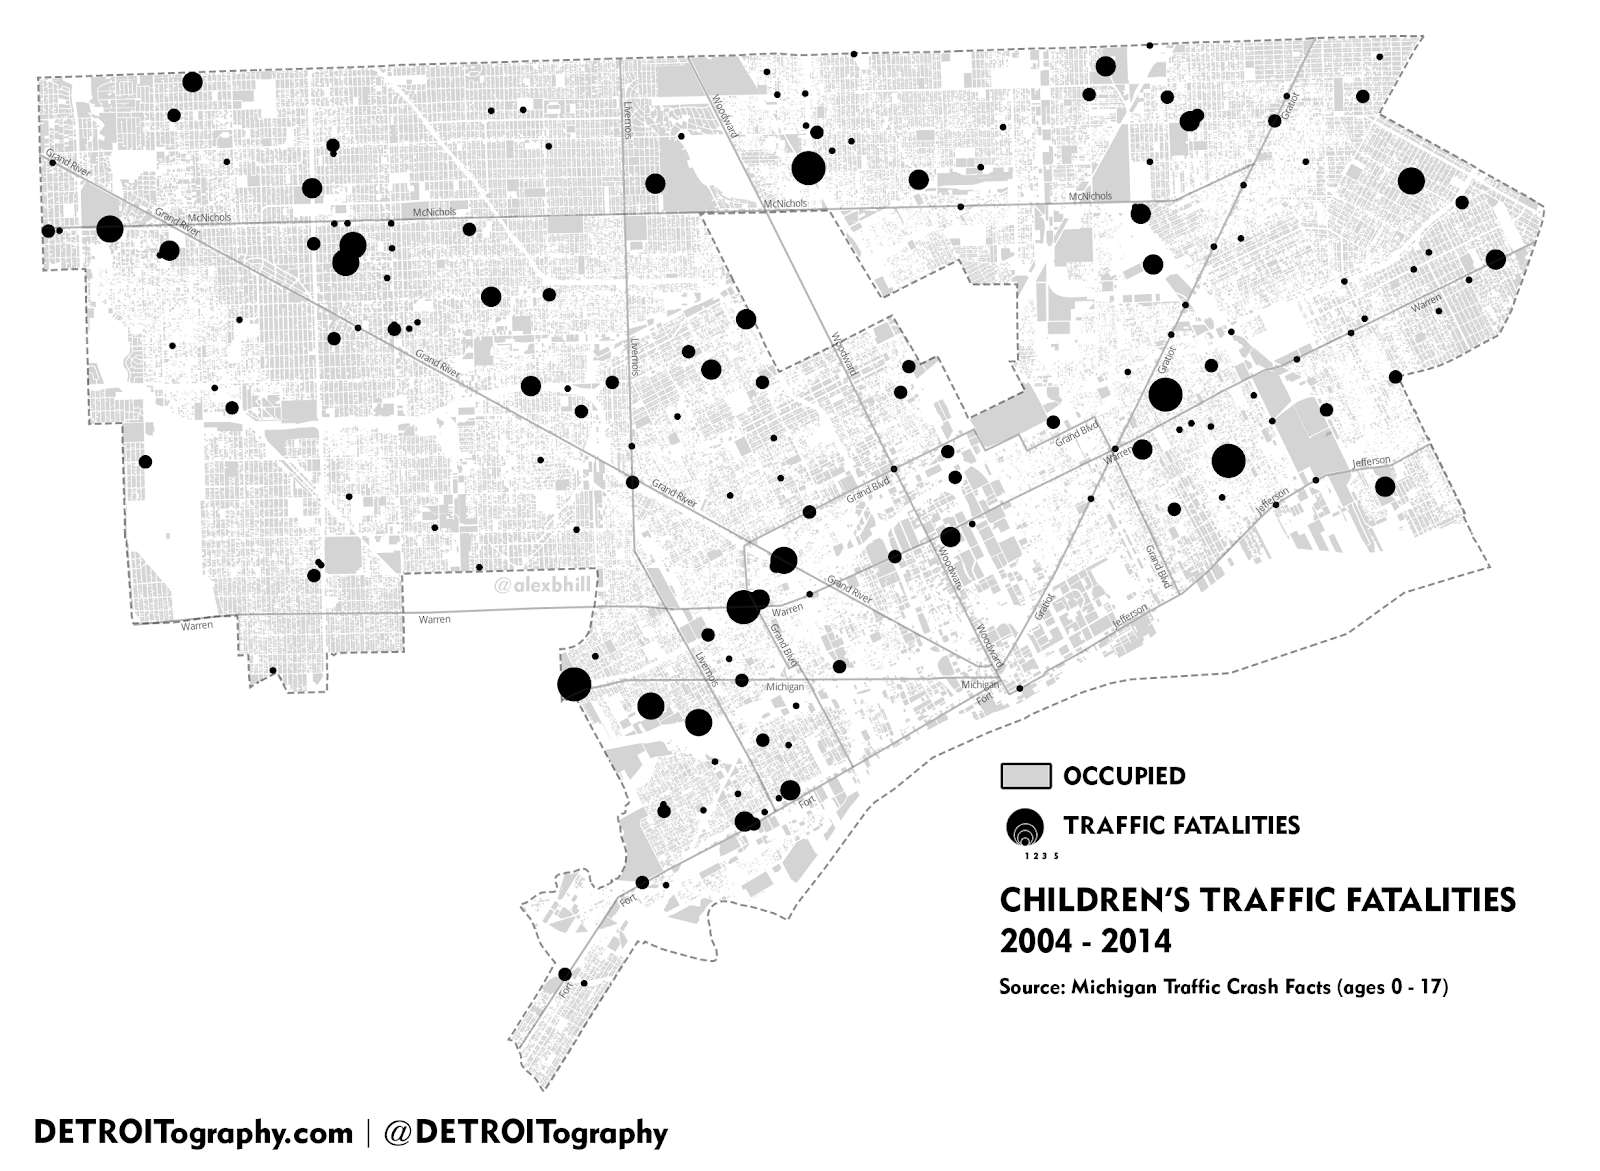 |
| Those lists of places could be geo-coded and turned into something like this, a map of Children's Traffic Fatalities in Detroit 2004-2014 (notice how the size of the dot indicates frequency). |
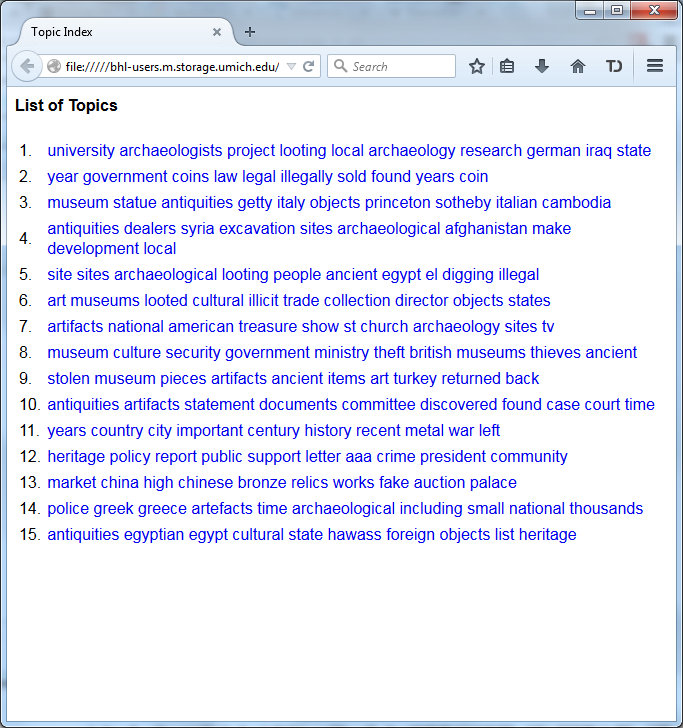
Topic Modeling
Topic modeling is a procedure used to derive topical content from documents. One of the
most frequently used tools for topic modeling is MALLET, which provides this
definition:
Topic models provide a simple way to analyze large volumes of unlabeled text. A "topic" consists of a cluster of words that frequently occur together. Using contextual clues, topic models can connect words with similar meanings and distinguish between uses of words with multiple meanings.
Tool
 |
| Topic Modeling Tool |
Whereas MALLET is a command-line tool, Topic Modeling Tool provides an interactive interface
Exercise
- Download Topic Modeling Tool.
- Open TopicModelingTool.jar.
- Click Select Input File or Dir and navigate to the unzipped looted_heritage_reports_txt folder (or use any folder of text files).
- Create a new folder on your computer to hold the topic model data you will create, such as looted_heritage_reports_text_output.
- Click Select Output Dir and select the new folder.
- For Number of topics: enter 15.
- Click Learn Topics.
- Take a look at the output_csv directory.
- Take a look at the output_html directory.
- Explore the Advanced… options.
This actual collection of looted heritage reports was used in Mining the Open Web with 'Looted Heritage'. If you scroll down to Findings - Topic Modeling, you can see how this author created descriptive labels for the key words discovered using MALLET (like you just did!) in a draft of a publication. A similar process could be used to turn topics into subject headings.
And there's more! Take a look at this example of topic modeling in action:
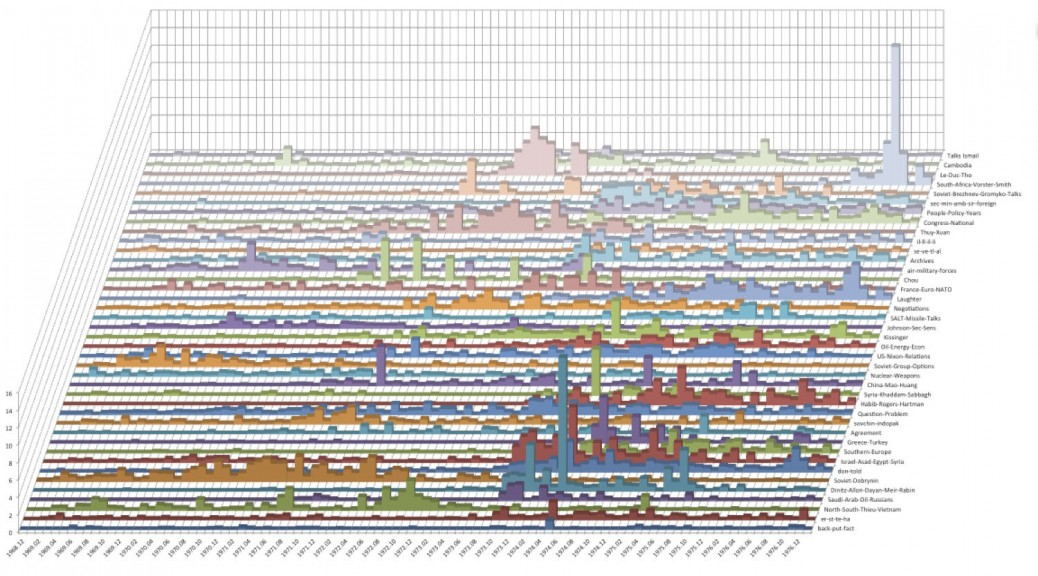 |
| Topic Model Stacked Bar Graphs from Quantifying Kissinger. |
Conclusion
What do you think? Could analysis of drives, digital forensics or digital humanities methods and tools be incorporated into your workflow, or have they been? How else are you overcoming the keyword searching problem? Is the keyword searching problem even a problem at all? What do your researchers think? Let us know!
Also, you should check out When You Have a MALLET, Everything Looks Like a Nail.
[1] At least according to this article, and this one as well. Yes, I was very thorough...
[2] Maybe. Possibly. Not as much as we like to think, probably. According to our most recent server logs for September (with staff users and bots filtered out), only 0.25% of users of our finding aids looked at our subject headings. That says something, even if it is true that our current implementation of subject headings is rather static.
[3] The following two sections contain content developed by Thomas Padilla and Devin Higgins for a Mid-Michigan Digital Practitioners workshop, Leveraging Digital Humanities Methods and Tools in the Archive. Thanks, guys!
No comments:
Post a Comment